Why R?
This page provides background info on R and why this course teaches it. For info on on software installation, see the Setup page.
Open-source
R is open-source software, which means using it is completely free. Open-source software is developed collaboratively, meaning the source code is open to public inspection, modification, and improvement. Thousands of expansion libraries have been published which extend the tasks R can perform, and users can write their own custom functions and/or libraries to perform specific operations.
Popular
Due to it’s cost (free) and versatilty, R is widely used in the social sciences, as well as in government, non-profits, and the private sector.
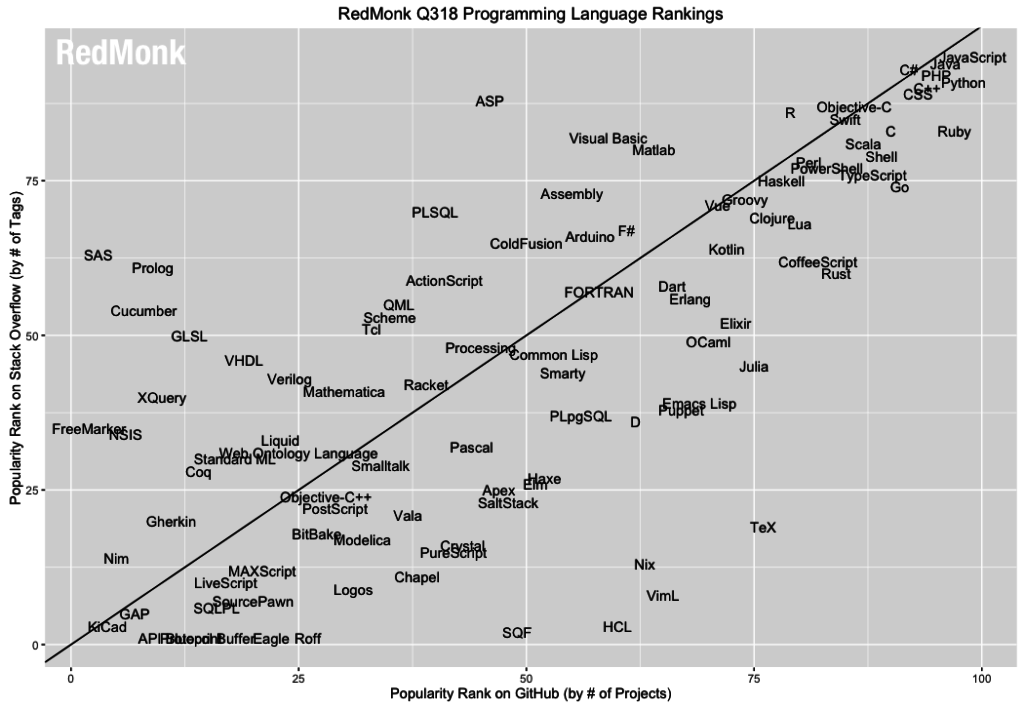
Many developers and social scientists write programs in R. As a result, there is also a large support community available to help troubleshoot problematic code. As seen in the Redmonk programming language rankings (which compare languages’ appearances on Github [usage] and StackOverflow [support]), R appears near the top of both rankings.
Lack of point-and-click interface
R, like any computing language, relies on programmatic execution of functions. That is, to do anything you must write code. This differs from popular statistical software such as Stata or SPSS which at their core utilize a command language but overlay them with drop-down menus that enable a point-and-click interface. While much easier to operate, there are several downsides to this approach - mainly that it makes it very hard if not impossible to reproduce one’s analysis (see here).
Things R does well
- Data analysis - R was written by statisticians for statisticians, so it is designed first and foremost as a language for statistical and data analysis. Much of the cutting-edge research in machine learning occurs in R, and every week there are packages added to CRAN implementing these new methods. Furthermore, many models in R can be exported to other programming languages such as
C,C++,Python,tensorflow,stan, etc. - Data visualization - while the base R
graphicspackage is comprehensive and powerful, additional libraries such asggplot2andlatticemake R the go-to language for power data visualization approaches.
Things R does not do as well
- Speed - while by no means a slug, R is not written to be a fast, speedy language. Depending on the complexity of the task and the size of your data, you may find R taking a long time to execute your program.
Why are we not using Python?
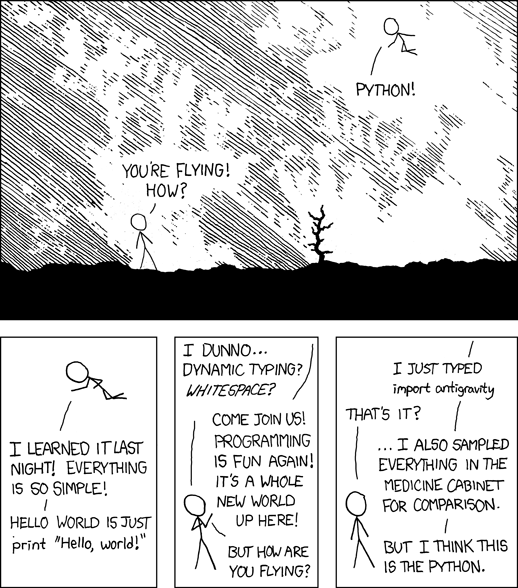
Python was developed in the 1990s as a general-purpose programming language. It emphasizes simplicity over complexity in both its syntax and core functions. As a result, code written in Python is (relatively) easy to read and follow as compared to more complex languages like Perl or Java. As you can see in the above references, Python is just as, if not more, popular than R, especially outside the social sciences. It also tends to be faster, more versatile at non-statistical tasks.
This course could be taught exclusively in Python, or a combination of R and Python. I think learning two languages simultaneously is difficult. It is better to stick with a single language and syntax. Once you complete this course, you will have the basic skills necessary to learn Python on your own.
At the end of the day, I don’t think it is a debate between learning R vs. Python. Frankly to be a desirable computational social scientist or data scientist you should learn both languages. R and Python complement each other, and even R/Python luminaries such as Hadley Wickham and Wes McKinney promote the benefits of both languages:
Acknowledgements
- This page is derived in part from “R vs Python for Data Science: The Winner is …”.
- This page has been developed starting from Benjamin Soltoff’s “Computing for the Social Sciences” course materials, licensed under the CC BY-NC 4.0 Creative Commons License.

